Recently, LI Hui's research team in Suzhou Institute of Biomedical Engineering and Technology, Chinese Academy of Sciences has developed an automatic segmentation method with an efficient edge-tracing algorithm for bright-field images of yeast cells.
Yeast is a commonly used model organism in biology due to its simple growth requirements and genetic tractability.
In genetic study, phenotyping of yeast with the genetic mutations related to human genetic diseases has been a great help to improve the human disease diagnosis and treatment.
During the studies, massive images of yeast cells are generally captured with microscopes to observe the different cell structures and behaviors under mutation or different drug treatments.
However, in general, the morphological analysis of yeast cells, which mainly depends on manual measurements by researchers, is time-consuming and has personal equation.
This new method is an automatic and efficient segmentation algorithm of yeast cell images, which can analyze the yeast cell’s morphology and detailed structures.
It detects accurate cell contour points called seed points automatically and then connects them by a fast and robust edge tracing algorithm.
The results show that 100% cells can be segmented properly in the images with sparsely distributed yeast cells. Meanwhile, in densely packed images, cells with normal morphology can also be correctly segmented while largely distorted cells were ruled out.
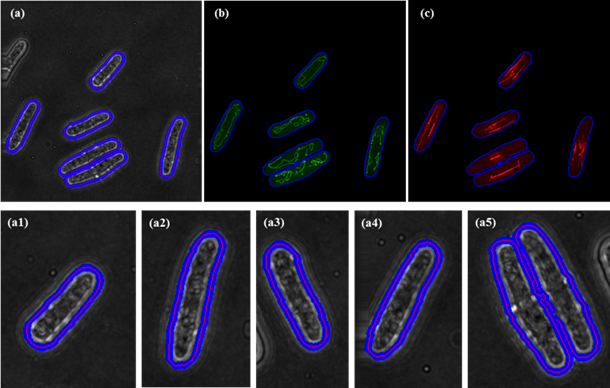
The bright-field segmentation results can be further used to labeling the fluorescent images.
These works entitled “Segmentation of yeast cell’s bright-field image with an edge-tracing algorithm” has been published in Journal of Biomedical Optics.

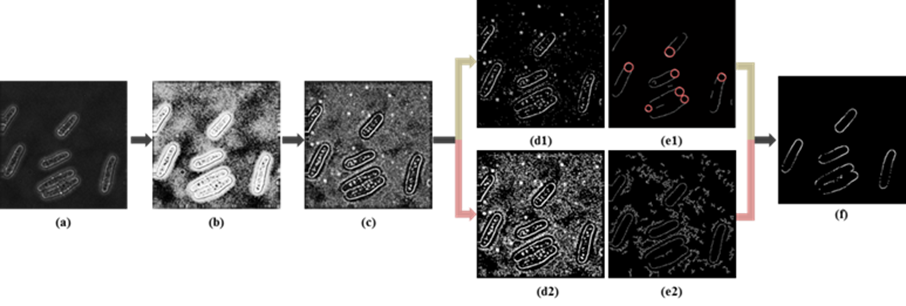
Fig. 1 Illustration of initial contour points detection. (a) Raw image; (b) Preprocessing results; (c) Gradient map; (d1) High-threshold edge map; (e1) Single-pixel edge map of (d1), and the red circle indicates the Hough Transform results of (e1); (d2) Low-threshold edge map; (e2) Single-pixel edge map of (d2); (f)Initial seed points.

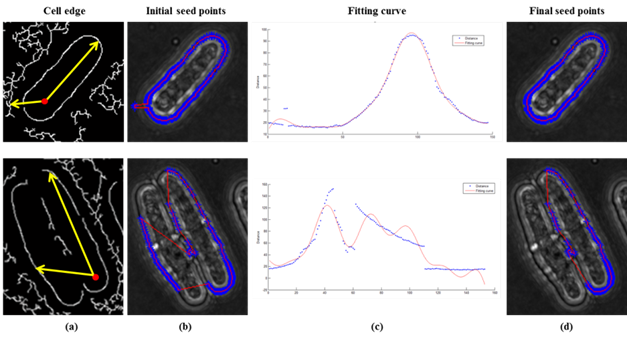
Fig. 2 Results of the seed points detection including the initial seed points detection and screening of them by the fitting curve to get the final seed points. Here we show two types of cells with different complexity: (a) cell edges; (b) initial seed points; (c) fitting curve of distances; (d) final seed points.

Fig. 3 Segmentation results of bright-field images with sparse cells. For illustration purpose, we show the segmentation of each cell (a1) ~ (a5) from (a). Then the corresponding mitochondria and microtubules are shown in (b) and (c).

Fig. 4 Segmentation results of bright-field images with dense cells are shown in (a), but still have some trouble (A and B marked with red circle). Then the corresponding mitochondria and microtubules are shown in (b) and (c).