MicroRNAs (miRNAs) are a type of non-coding small RNAs that are the key regulators of gene expression. Abnormal expression of certain miRNAs always occurs in pathological cells. Thereby, development of reliable detection methods in sensing cellular miRNAs for biomedical researches and clinical diagnosis is in urgent need.
Recently, MIAO Peng’s group in Suzhou Institute of Biomedical Engineering and Technology of Chinese Academy of Sciences has proposed a novel ratiometric sensing strategy for sensitive and selective detection of miRNA by coupling chameleon silver nanoclusters (AgNCs) with hybridization chain reaction (HCR).
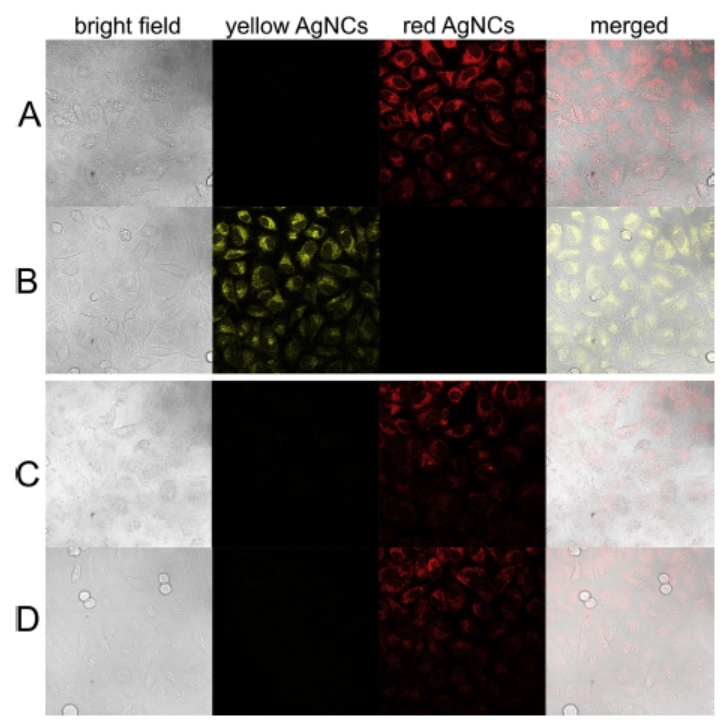
In this work, three DNA probes are designed for synthesizing AgNCs, capturing target miRNA and supporting HCR, respectively. Targeted miRNA can trigger hybridization reactions successfully and change the fluorescence emissions of AgNCs. This can be detected by the established ratiometric biosensor for the miRNA assay. The integrated HCR improves the sensitivity significantly. In situ cellular imaging experiment, color switching from red to yellow upon target miRNA induced reactions is also observed. Therefore, the proposed method may have great potential to be used as a powerful tool for miRNA diagnostics.
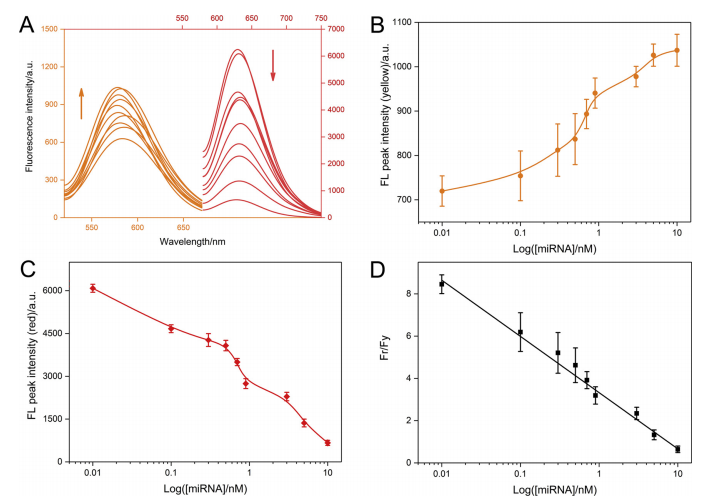
Experimental results showed that a linear relationship is established between Fr/Fy and the logarithmic miRNA concentration is from 10-11 to 10-8 M. The equation is as follows: y = 3.325 - 2.661 x (n = 3, R2 = 0.992), in which y stands for Fr/Fy and x is the logarithmic miRNA concentration. The limit of detection is calculated as low as 2.8 pM.
This work entitled “Chameleon silver nanoclusters for ratiometric sensing of miRNA” has been published in Sensors & Actuators: B. Chemical.

Figure 1: (A) Fluorescence emission spectra of signal probe-templated AgNCs after hybridizations in the presence of target miRNA (0, 0.01, 0.1, 0.3, 0.5, 0.7, 0.9, 3, 5, 10 nM). Yellow curves are excited at 500 nm while red curves are excited at 565 nm. (B) Calibration curve reflecting the relationships between fluorescence peak intensity of yellow AgNCs and the logarithmic concentration of miRNA. (C) Calibration curve reflecting the relationship between fluorescence peak intensity of red AgNCs and the logarithmic concentrations of miRNA. (D) Calibration plot reflecting the relationship between the ratio of fluorescence peaks (Fr/Fy) and the logarithmic concentration of miRNA.(Image by JIANG Yiting)

Figure 2: Confocal microscopy images of (A) HeLa cells incubated with signal probe-templated AgNCs; (B) HeLa cells incubated with signal probe-templated AgNCs, capture probe and auxiliary probe; (C) HUVEC cells incubated with signal probe-templated AgNCs; (D) HUVEC cells incubated with signal probe-templated AgNCs, capture probe and auxiliary probe.(Image by JIANG Yiting)
Contact
XIAO Xintong
Suzhou Institute of Biomedical Engineering and Technology, Chinese Academy of Sciences (http://www.sibet.cas.cn/)
Phone: 86-512-69588013
E-mail: xiaoxt@sibet.ac.cn